Event technology trends: Effectively applying the data you already have
Every piece of venue technology you’ve already adopted is generating data. Here’s what each one produces, and how to actually use it.

Alexander Boyles
Marketing

Most of the technology a venue has already adopted was chosen for what it does at the point of use. A card reader speeds up a transaction, a booking page takes a reservation without a phone call, and a membership gives a family a reason to come back. Each technology performs a vital function, but it also generates a valuable stream of data and customer insights.
What follows is a look at five technologies most FECs and experience venues already run, what data each one is quietly producing, and how venues can effectively apply that data to improve their operations and experiences.
Cashless payments and digital wallets
Cashless is close to a completed transition. Card readers now carry 37% of amusement machine transactions and 79% of sales volume, up from 22% and 66% a year earlier, and the average cashless ticket runs $6.04 against $0.81 for cash. Digital wallets are moving the same direction, accounting for 23.8% of online transactions across more than 3,000 venues at nearly twice the average value of a physical card.
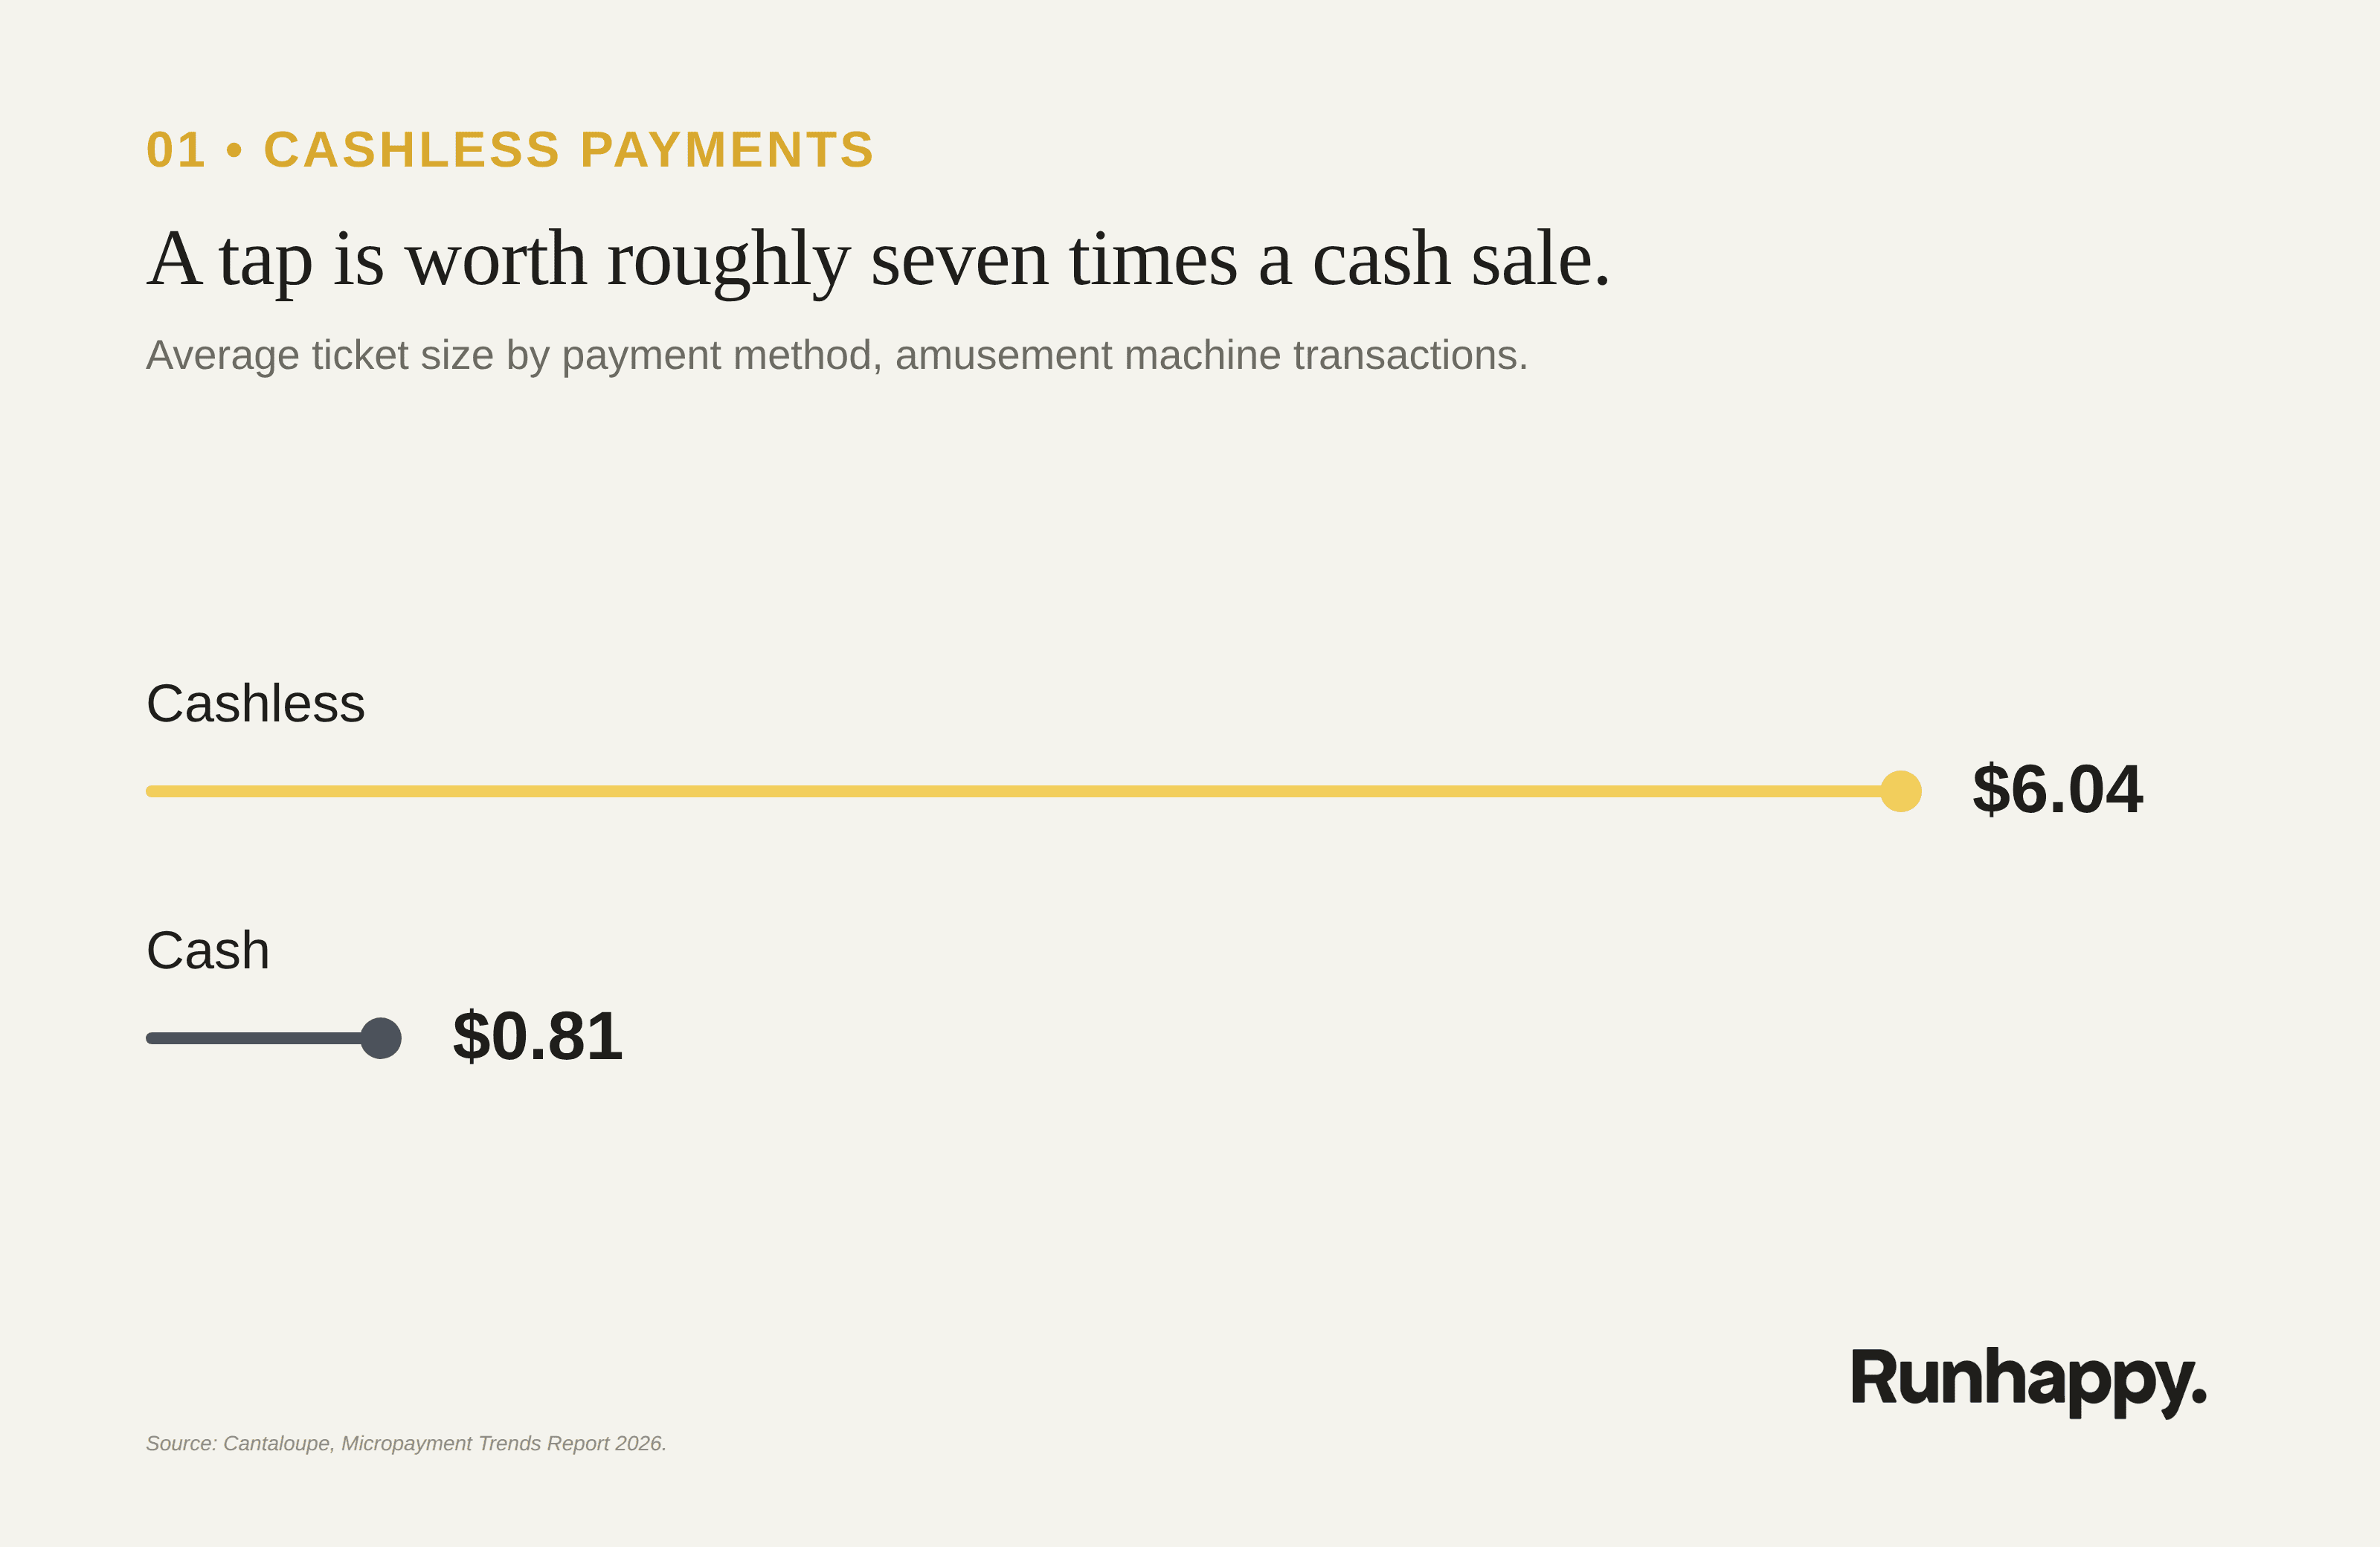
The data this generates is transaction-level, covering ticket size, time of day, and which payment method a given guest actually used.
Mapped against a venue’s own packages, that data does real work:
Ticket size by package shows which specific packages and add-ons actually drive spend, not just which ones sell the most units, so upsell effort can go toward what’s proven instead of what’s assumed, raising average order value without adding a single new promotion.
Time-of-day patterns show exactly when the highest-value transactions happen, which can inform staffing during peak slots or when a promotion is worth running versus when demand is already strong enough without one, avoiding a discount that wasn’t needed and coverage that wasn’t earning its cost.
Digital wallet share that lags the rest of a multi-location operator’s average is a concrete, checkable signal, worth looking at against hardware, signage, or staff prompts rather than assumed to be guest preference, since closing that gap recovers the same average-ticket lift already showing up everywhere else it’s higher.
A venue that looks at this data can see which packages and moments carry the highest spend instead of assuming every party or session is worth roughly the same. Without these insights, a venue only sees a revenue number at the end of the month with no explanation attached to it.
Self-serve booking pages
Guests have made their preference clear. In a 2025 survey of 2,000 attraction guests across the US, UK and Australia, 90% said they prefer to book online, 90% wanted self-serve options on site, and 97% plan a visit at least a day in advance.
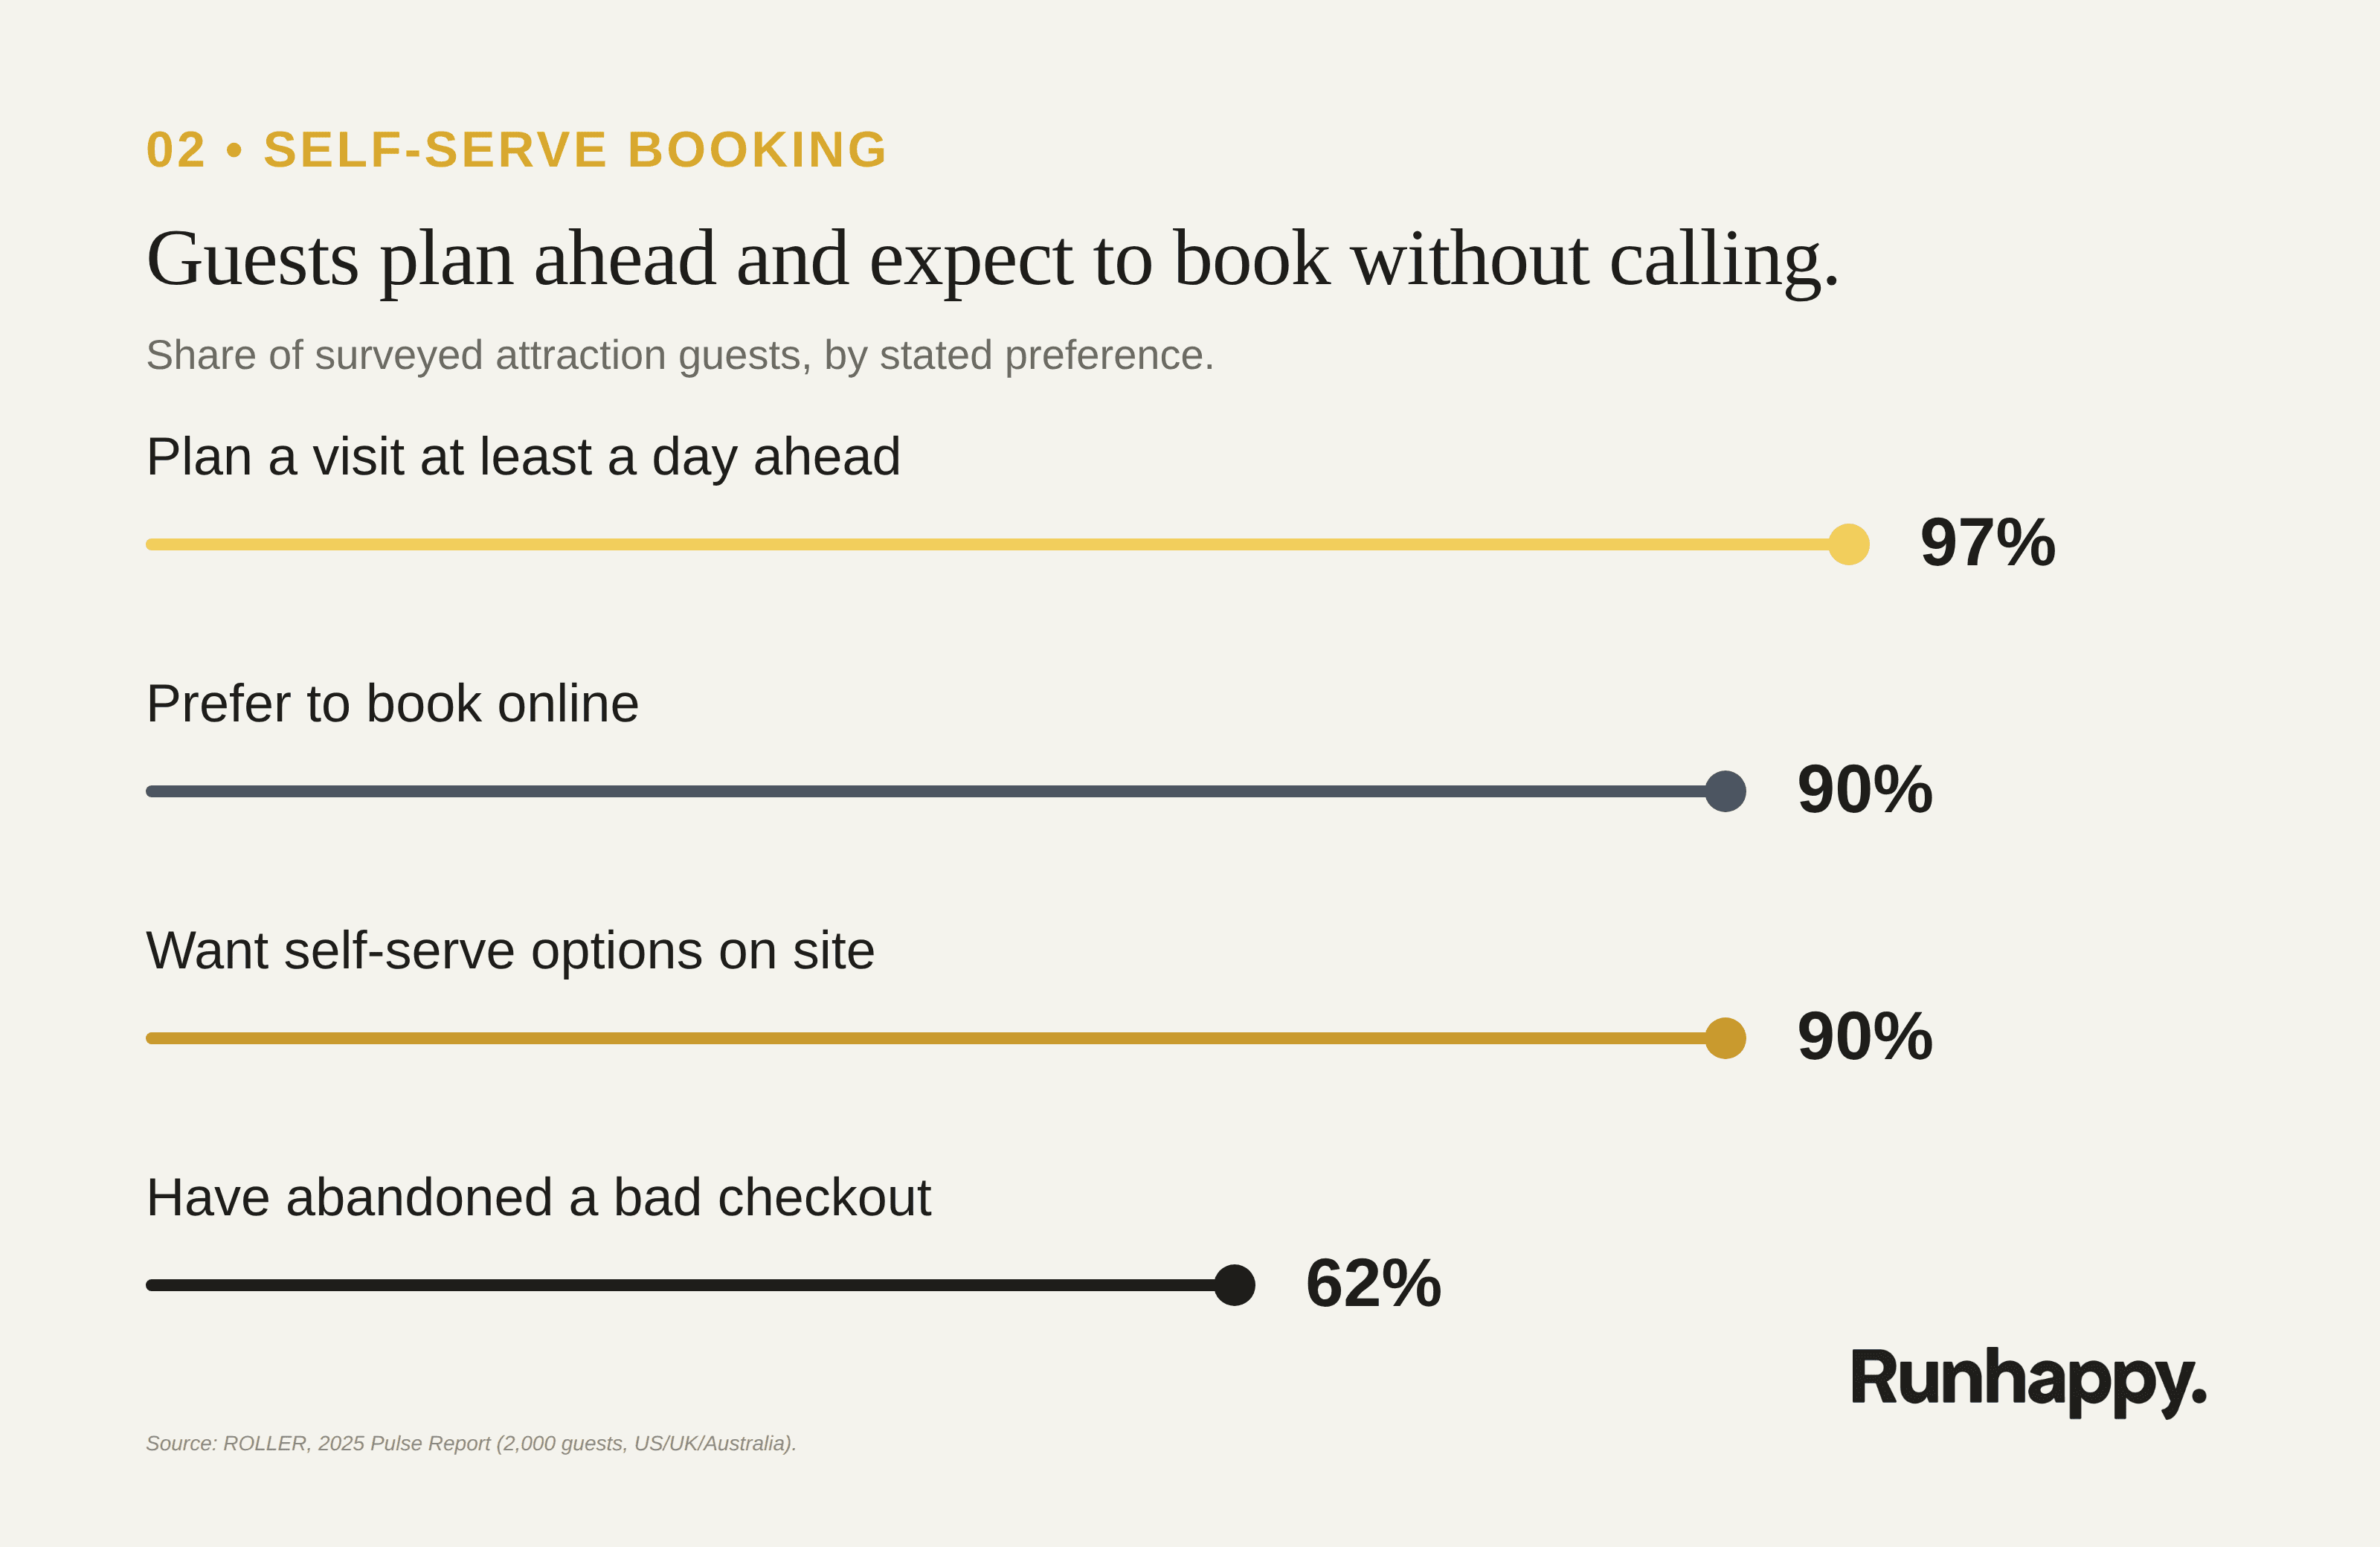
A booking page also shows a venue exactly where guests hesitate or give up, which most phone and in-person bookings never reveal. In the same survey, 62% of guests had abandoned a booking because of a frustrating checkout, faster checkout was the single most requested improvement at 23%, and hidden fees or unclear pricing were the top frustration for more than a third of guests. That is behavioral data most venues already have sitting inside their own booking platform, showing exactly where in the flow people drop off and why. Heat map data adds another layer to that picture, usually captured through an analytics or heat-mapping tool layered directly onto the booking page. It’s standard on most modern booking pages now, covering time spent on each part of the page, where clicks concentrate, and how far someone scrolls before leaving, and it’s a direct read on a venue’s own page rather than an industry average.
Most of the advantage of self-serve booking gets decided on the page itself, which is why event pages that convert have become their own discipline rather than an afterthought to a venue’s main site. Mapped against a venue’s own page, this data turns a falling conversion rate into a specific fix:
A high checkout-abandonment rate points to friction at that exact step, worth testing directly instead of redesigning the whole page.
A package description nobody scrolls far enough to reach signals a placement problem on the page itself, separate from how popular the package actually is.
Click concentration away from the main booking button suggests the call-to-action isn’t visible enough, or something earlier on the page is competing for attention.
A venue that looks at this data can see exactly where its own page is losing bookings instead of guessing at a redesign. Without it, a falling conversion rate stays a mystery with no obvious resolution.
Membership and loyalty portals
Membership adoption data usually gets framed as a retention question. The mechanism behind it is typically a membership or loyalty management platform, often already built into a venue’s point-of-sale or booking system.
The number that matters more than adoption rate is that 41.20% of guests visit the same attraction more than once a year without holding a membership at all. Those are already repeat guests, and without a portal or membership record attached to them, they show up as a new visitor every single time. The survey data suggests guest willingness isn’t the barrier either: 82.53% said they’re willing to share personal data in exchange for personalized rewards, with 43.13% willing without hesitation, and 84.47% said loyalty programs influence where they choose to book in the first place.
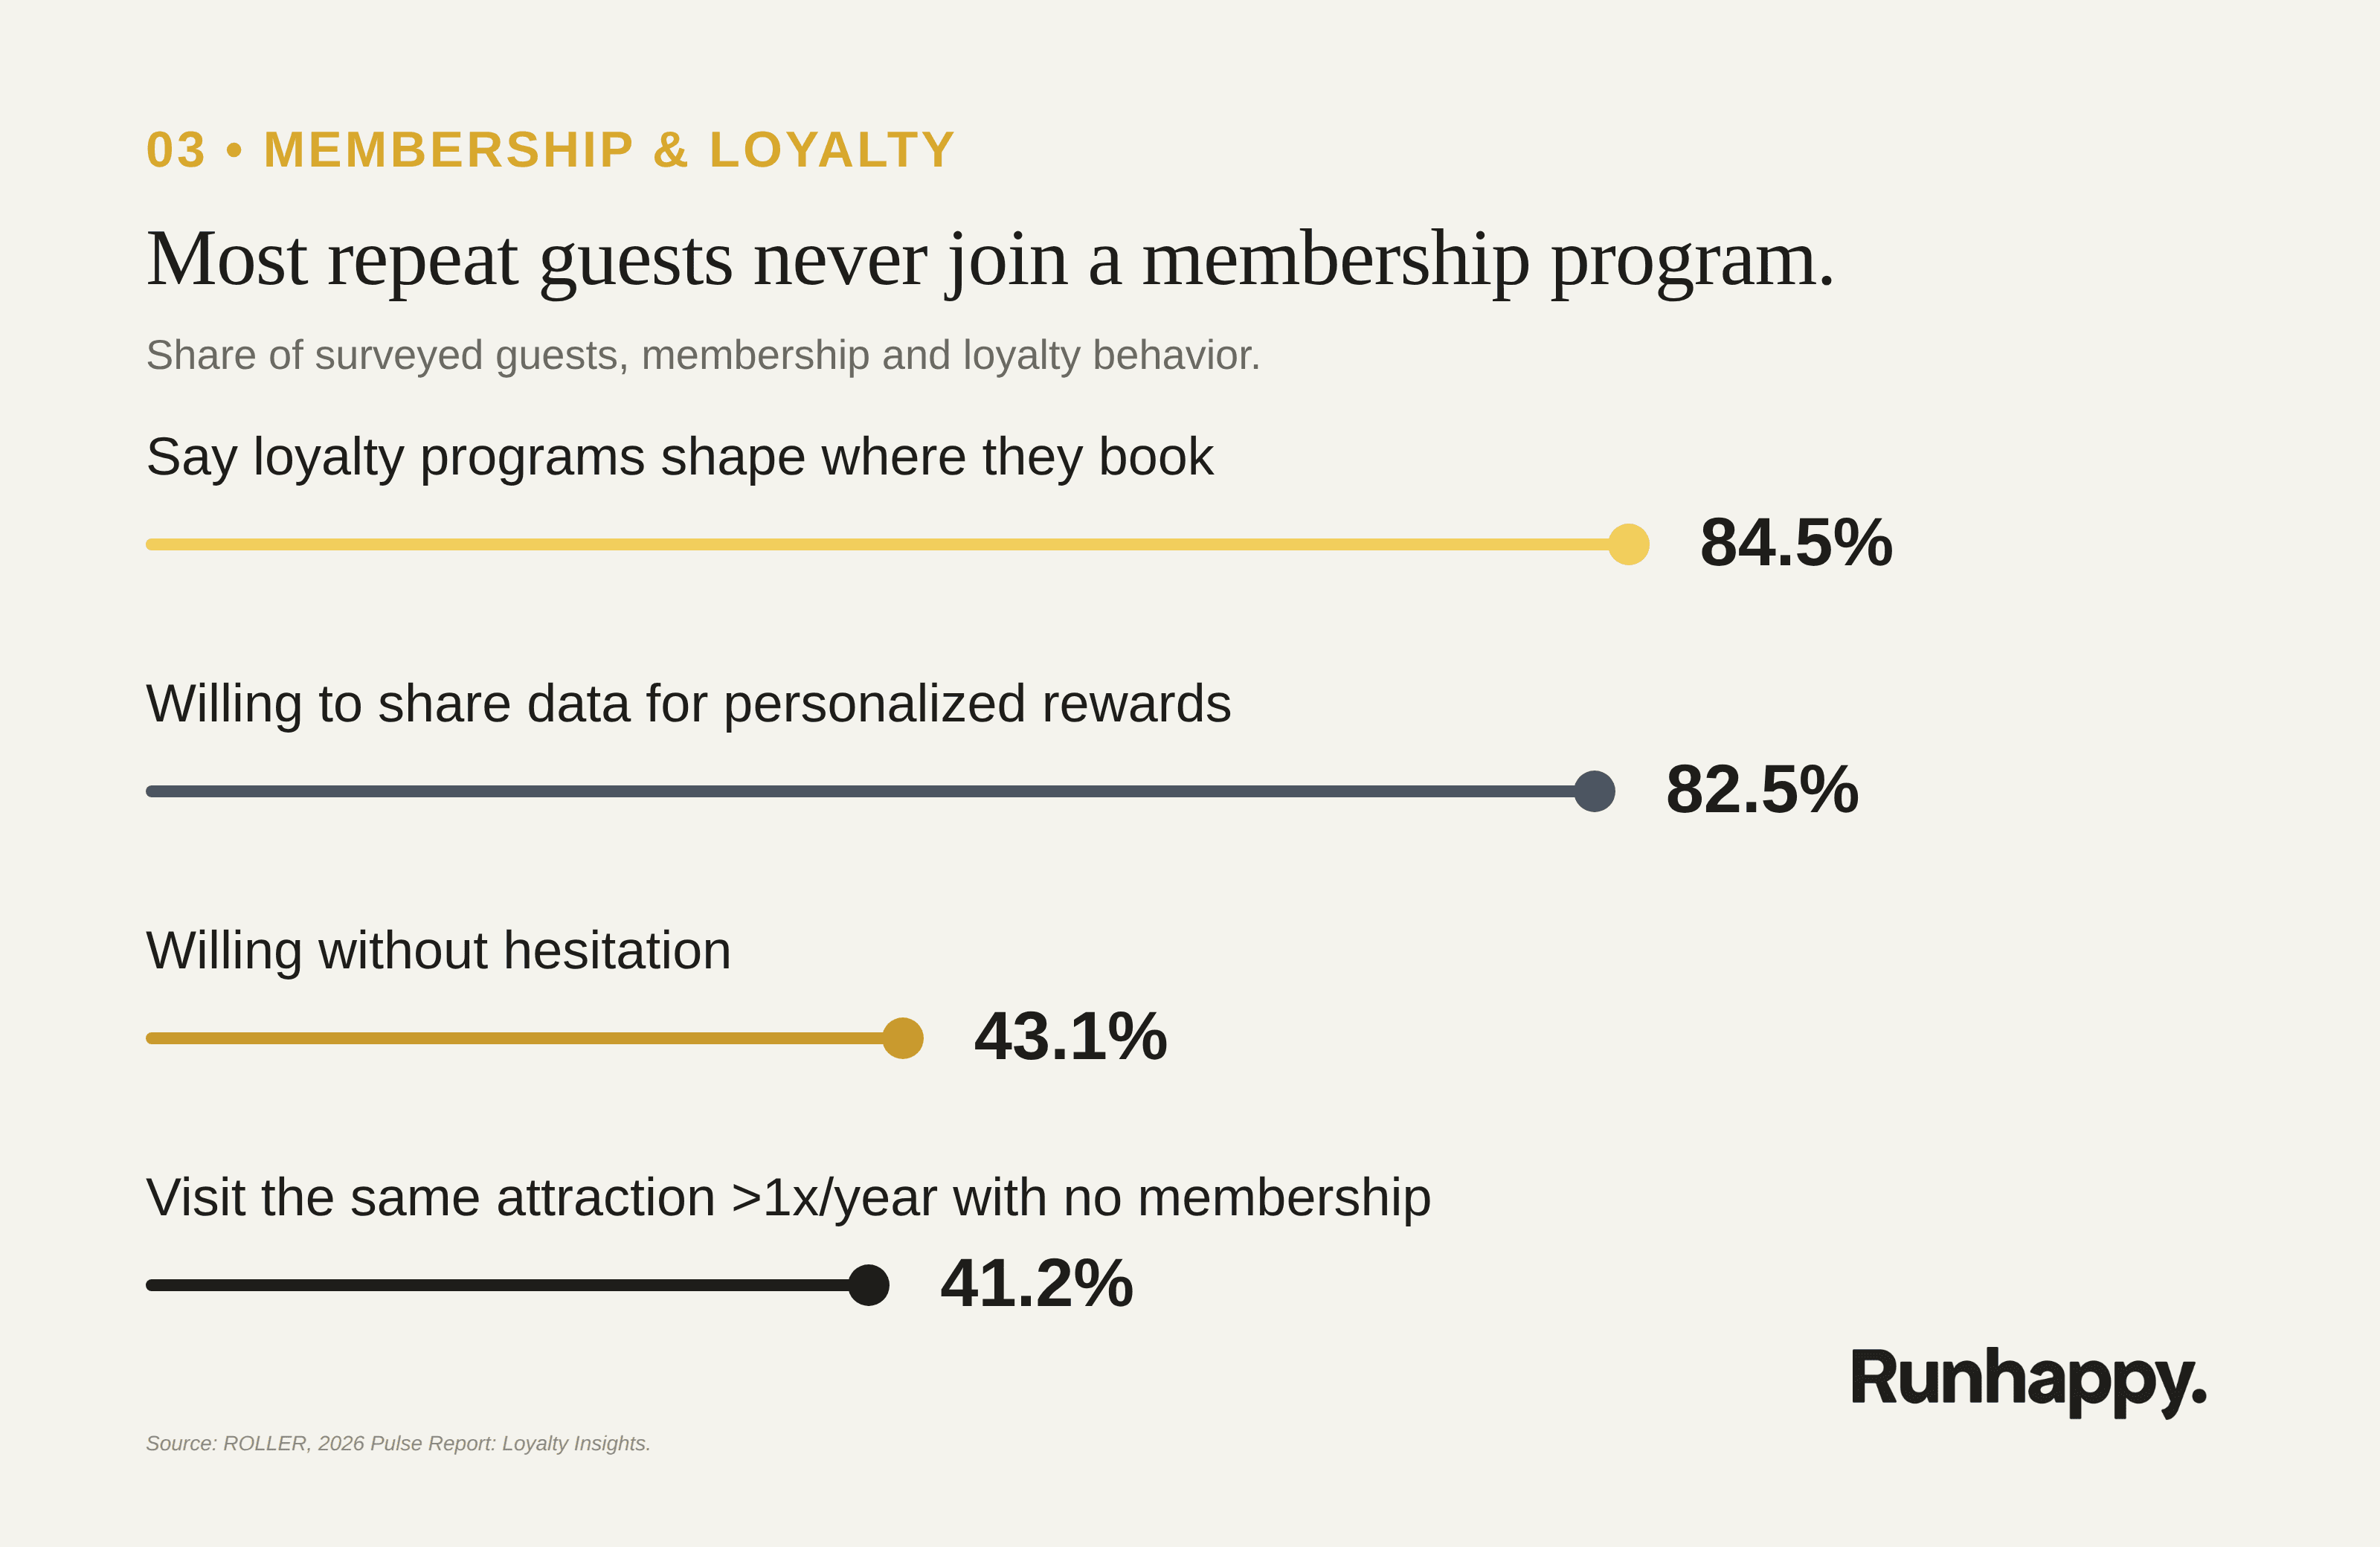
A membership portal is the mechanism that turns an anonymous regular into an identified, addressable guest, which is the data a venue needs to market to its best visitors directly instead of re-earning every visit from a stranger. Mapped against what the data shows, a portal does specific work:
Visit history identifies guests who are already repeat visitors, so a venue can target proven regulars directly instead of treating them as new every time.
High data-sharing willingness shows guests are open to it already, so a venue can ask directly without expecting pushback.
Loyalty-program influence on booking decisions means a portal shapes which venue gets chosen in the first place, in addition to how often someone returns afterward.
A venue that looks at this data can turn its existing regulars into a channel it actually reaches, rather than guests it hopes come back on their own. Without it, some of a venue’s best guests stay invisible no matter how often they’ve already visited.
Messaging across channels
Guests don’t use one channel to reach a venue, and they’ve stopped tolerating a slow one. In a 2026 survey of 959 US consumers, 87% check a text within 15 minutes of receiving it and 70% expect a business to respond within an hour. Text isn’t even the dominant channel on its own. 81% will use it at least sometimes to contact a business, but only 46% treat it as their primary method, against 55% for email and 43% for phone.
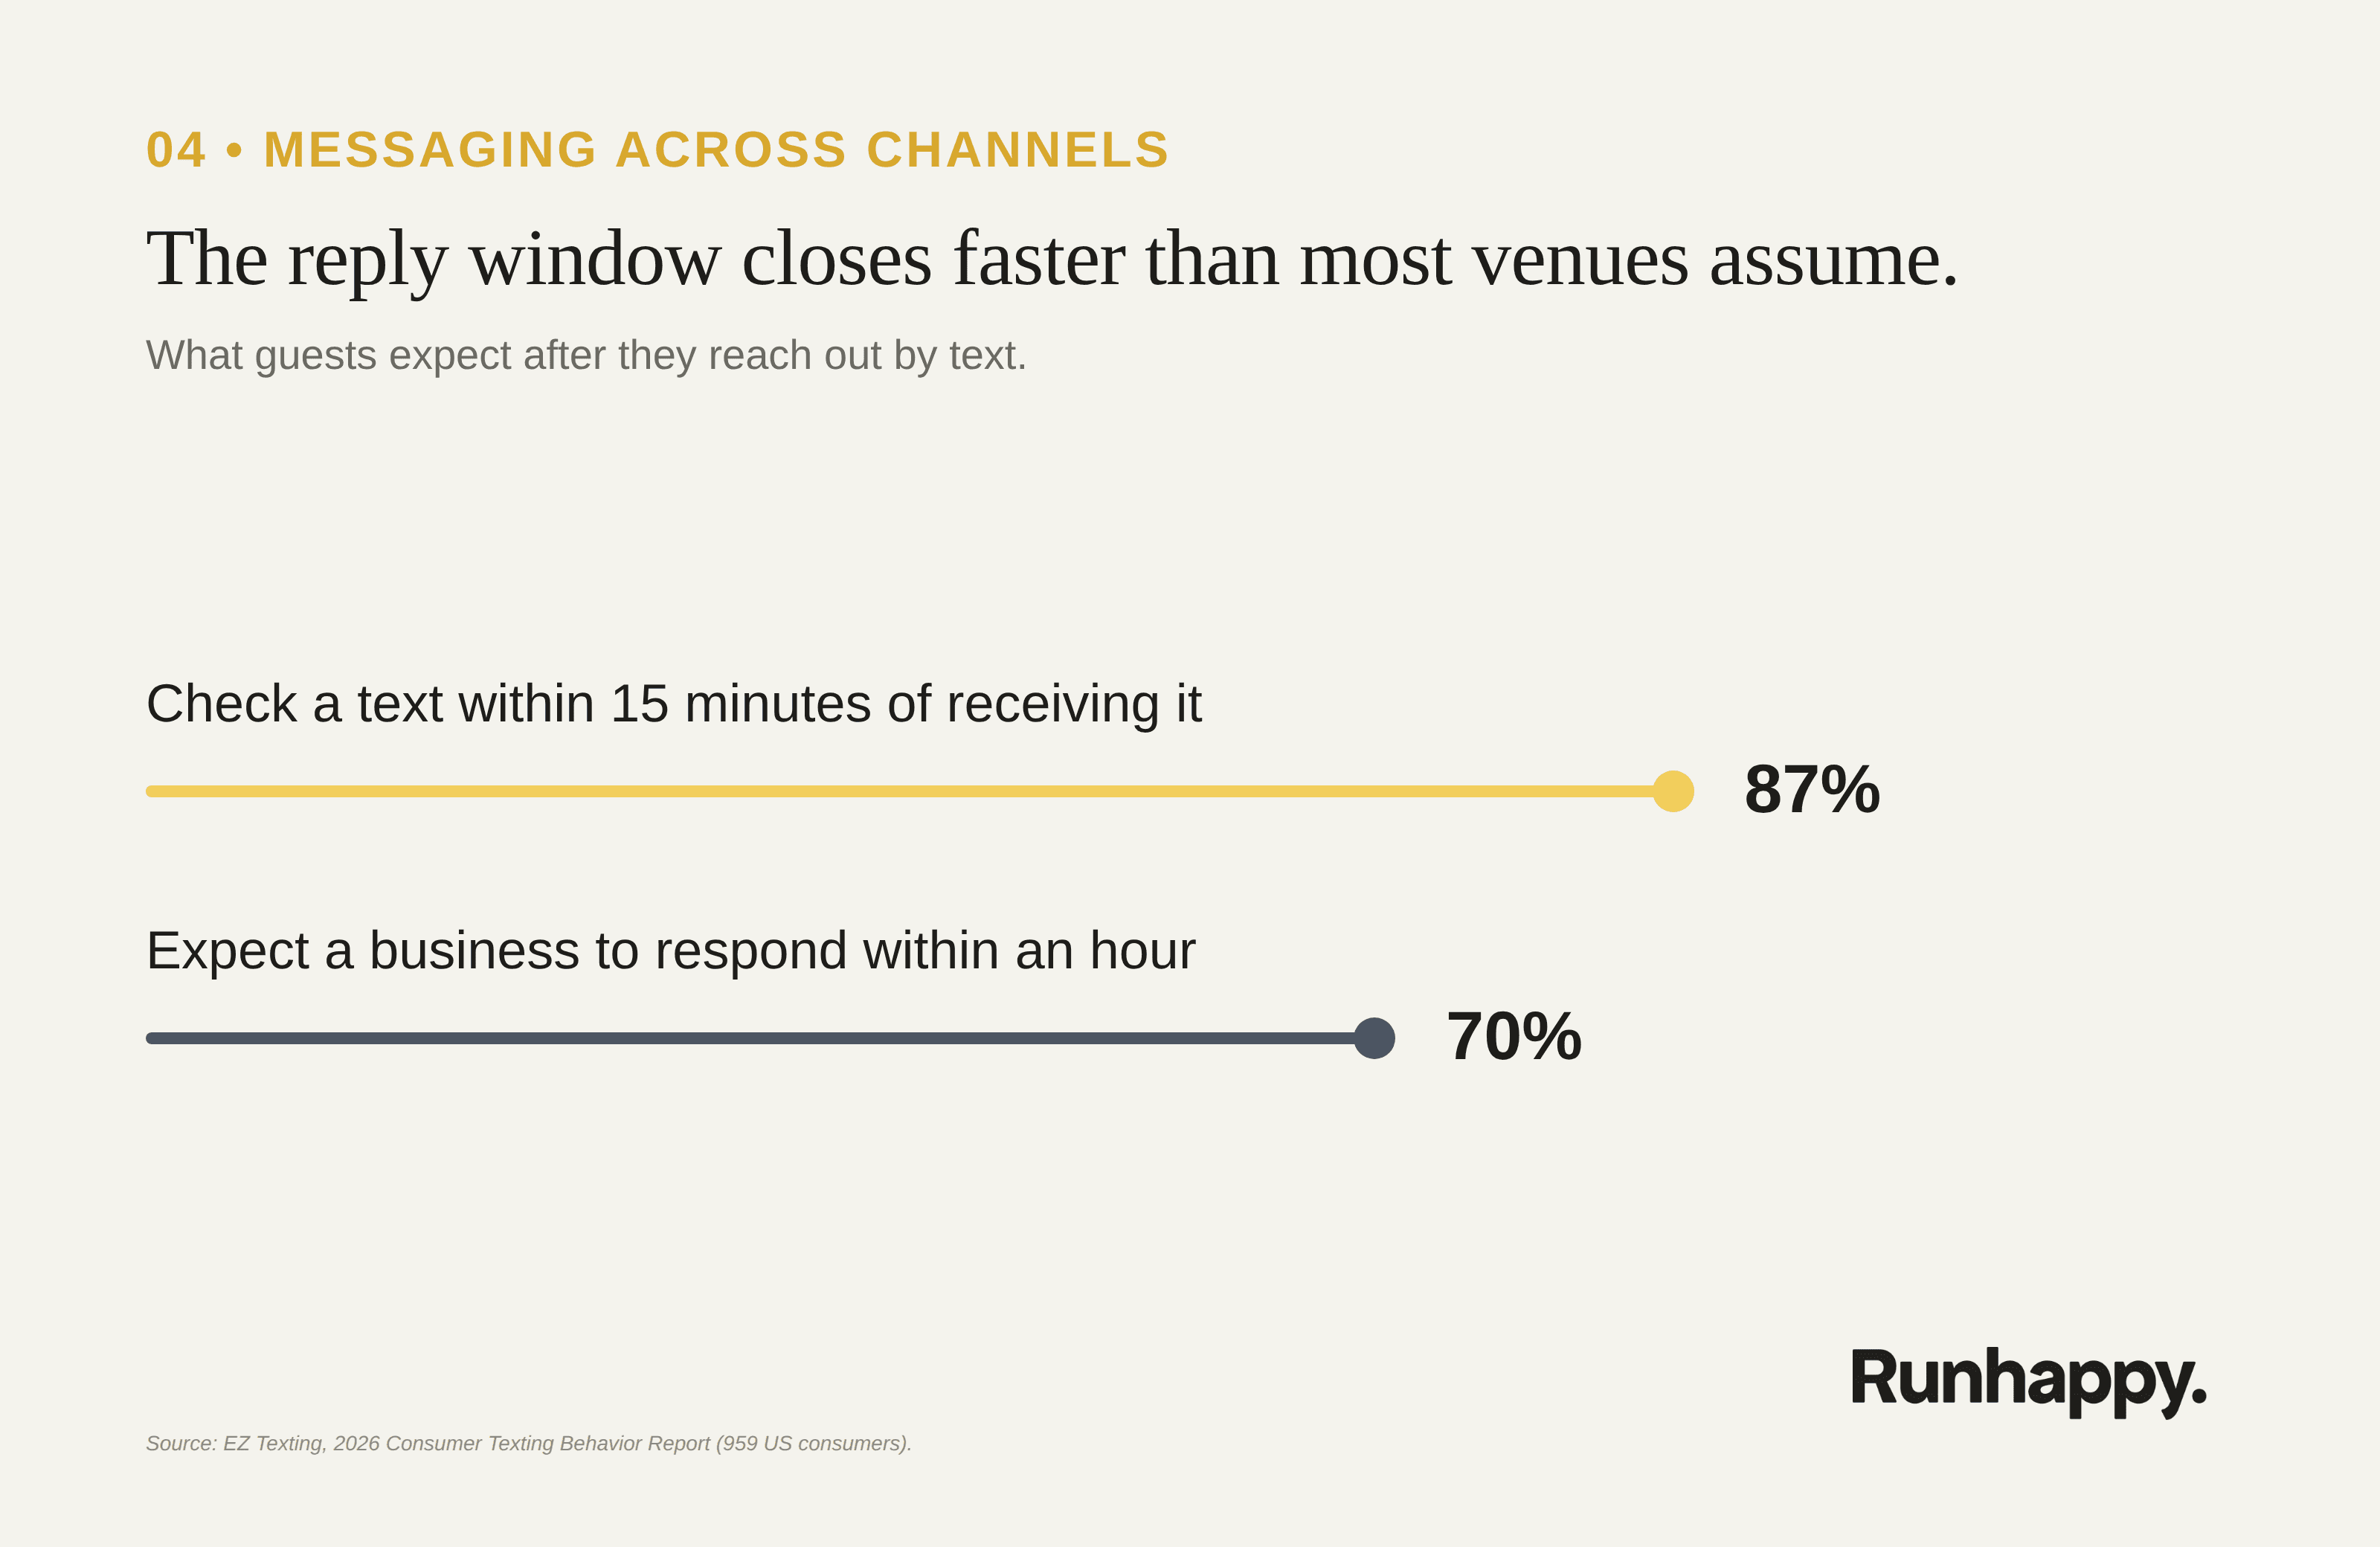
That split is the real data problem. A venue running five channels with no shared record of them only knows what’s sitting in whichever inbox, phone, or DM the message happened to land in. Conversation-level data, what a guest asked, which channel they used, and how long they waited, only exists if something, typically a unified inbox or a CRM built to log every channel in one place, is capturing it across all of them at once rather than one at a time.
The value of actually using that data shows up in real numbers, not just in theory:
One multi-location operator cut the average time from first inquiry to confirmed booking from three days to under 24 hours by treating every channel’s inquiries as a single queue instead of several separate ones, and attributed roughly $400,000 in additional revenue to the change.
A separate venue recovered close to $50,000 in bookings by re-engaging a backlog of inquiries that had gone quiet, running the same process it would use on a brand-new inquiry instead of writing the backlog off.
Neither result came from collecting new data. Both came from using data the venue already had sitting across its own channels.
Staff and scheduling tools
Scheduling software is usually adopted to solve a coverage problem.
It also produces a record of exactly where coverage is thin. Research across 2,000 frontline retail and hospitality workers in the UK found schedule stability to be the weakest area measured, with 89% reporting a shift changed or cancelled with less than 48 hours’ notice in the last three months, and the researchers put the sector-wide cost of that instability at £6.7 billion in replacement and lost-efficiency exposure. That data is from retail and hospitality broadly rather than FECs specifically, but the shape of the problem, hourly staff covering unpredictable footfall, is the same one most event sales teams run into.
The operational data this generates is what tells a venue where its own thin spots actually are, rather than finding out after an inquiry went unanswered:
Response times by shift show which specific shifts consistently run behind, so a venue can target coverage or staffing changes to those hours instead of adding headcount across the board.
Coverage gaps by hour show exactly when inquiries are most likely to go unanswered, turning a schedule fix from a guess into something aimed at the actual gap.
A venue that looks at this data can fix the specific shifts driving instability instead of treating every hour as equally at risk. Without it, a coverage gap only shows up after an inquiry has already gone unanswered.
Where pricing and promotions fit
For most venues, the more immediate use of this kind of data is deciding when to run a discount, a promo code, or a bundled package. Demand-pattern data is what that decision actually needs. A venue that can see which days and time slots already sell well can leave those alone, and a venue that can see which ones are consistently soft knows exactly where a promotion would move bookings rather than discounting demand that was already there.
Full dynamic pricing is the same idea carried further, and it’s still mostly an enterprise-tier practice. About 7% of operators overall use it, while enterprise attractions are already at 12% and expect that to nearly triple within a year. Both depend on demand data a venue already has, or could be collecting through its booking and scheduling systems, rather than data that shows up as a byproduct of something else. The venues moving fastest on either pricing or promotions are the ones that already had that data collected and usable.
Frequently asked questions
What data does a cashless payment system actually generate for a venue
Transaction-level detail for every purchase, covering ticket size, time of day, and payment method. Most of that already sits inside the payment platform; the gap is usually in looking at it rather than collecting it.
Do guests actually want venues to collect more of their data?
The data says yes, with conditions. Over 80% of surveyed guests said they’d share personal data in exchange for personalized rewards, and most of those were willing without hesitation. The expectation is that the data gets used for something the guest can see the benefit of, not collected and left unused.
What’s the most overlooked data source most FECs already have?
Membership and loyalty data is the clearest case. Over 40% of repeat guests in one survey had no membership on file at all, meaning a large share of a venue’s best guests are invisible to it despite visiting more than once a year.
Should a venue collect more data before considering dynamic pricing or more targeted promotions?
Yes, and for most venues the promotions decision comes first. Demand-pattern data shows exactly when a discount or bundled package would move bookings instead of discounting demand that was already there. Full dynamic pricing depends on the same kind of data, and it’s moving fastest among enterprise operators, who are also the ones most likely to already have that data infrastructure in place.
Does messaging data matter if a venue already has a booking platform?
A booking platform captures what happens after a guest decides to book. Messaging data captures everything before that, which channel a guest used, what they asked, and how long they waited for an answer, which is where a lot of decisions to book (or not) actually get made.
Our Blog.


Stay in the Loop
More bookings. Higher upsells. Fewer missed leads. Subscribe to our newsletter for the strategies and stories behind venues running on autopilot with Runhappy.